This is a demo post in which we begin the blog. The idea here is that you create one post with this quarto document. The quarto document for a post will be named “index.qmd” insides of folder with the name of the post. For example, if I wanted my post to be titled “Demo Post 1” then I would do the following.
Create a folder named “Demo Post 1” inside of the “posts” folder.
Create a new quarto document (like this one) and in the header have title: "Demo Post 1".
Save that new quarto document inside the “Demo Post 1” folder with the name index.qmd.
After doing that, you can then edit the index.qmd document for that new post to your heart’s content. Lets do a little of that now so you can see how this might work.
Including Resources
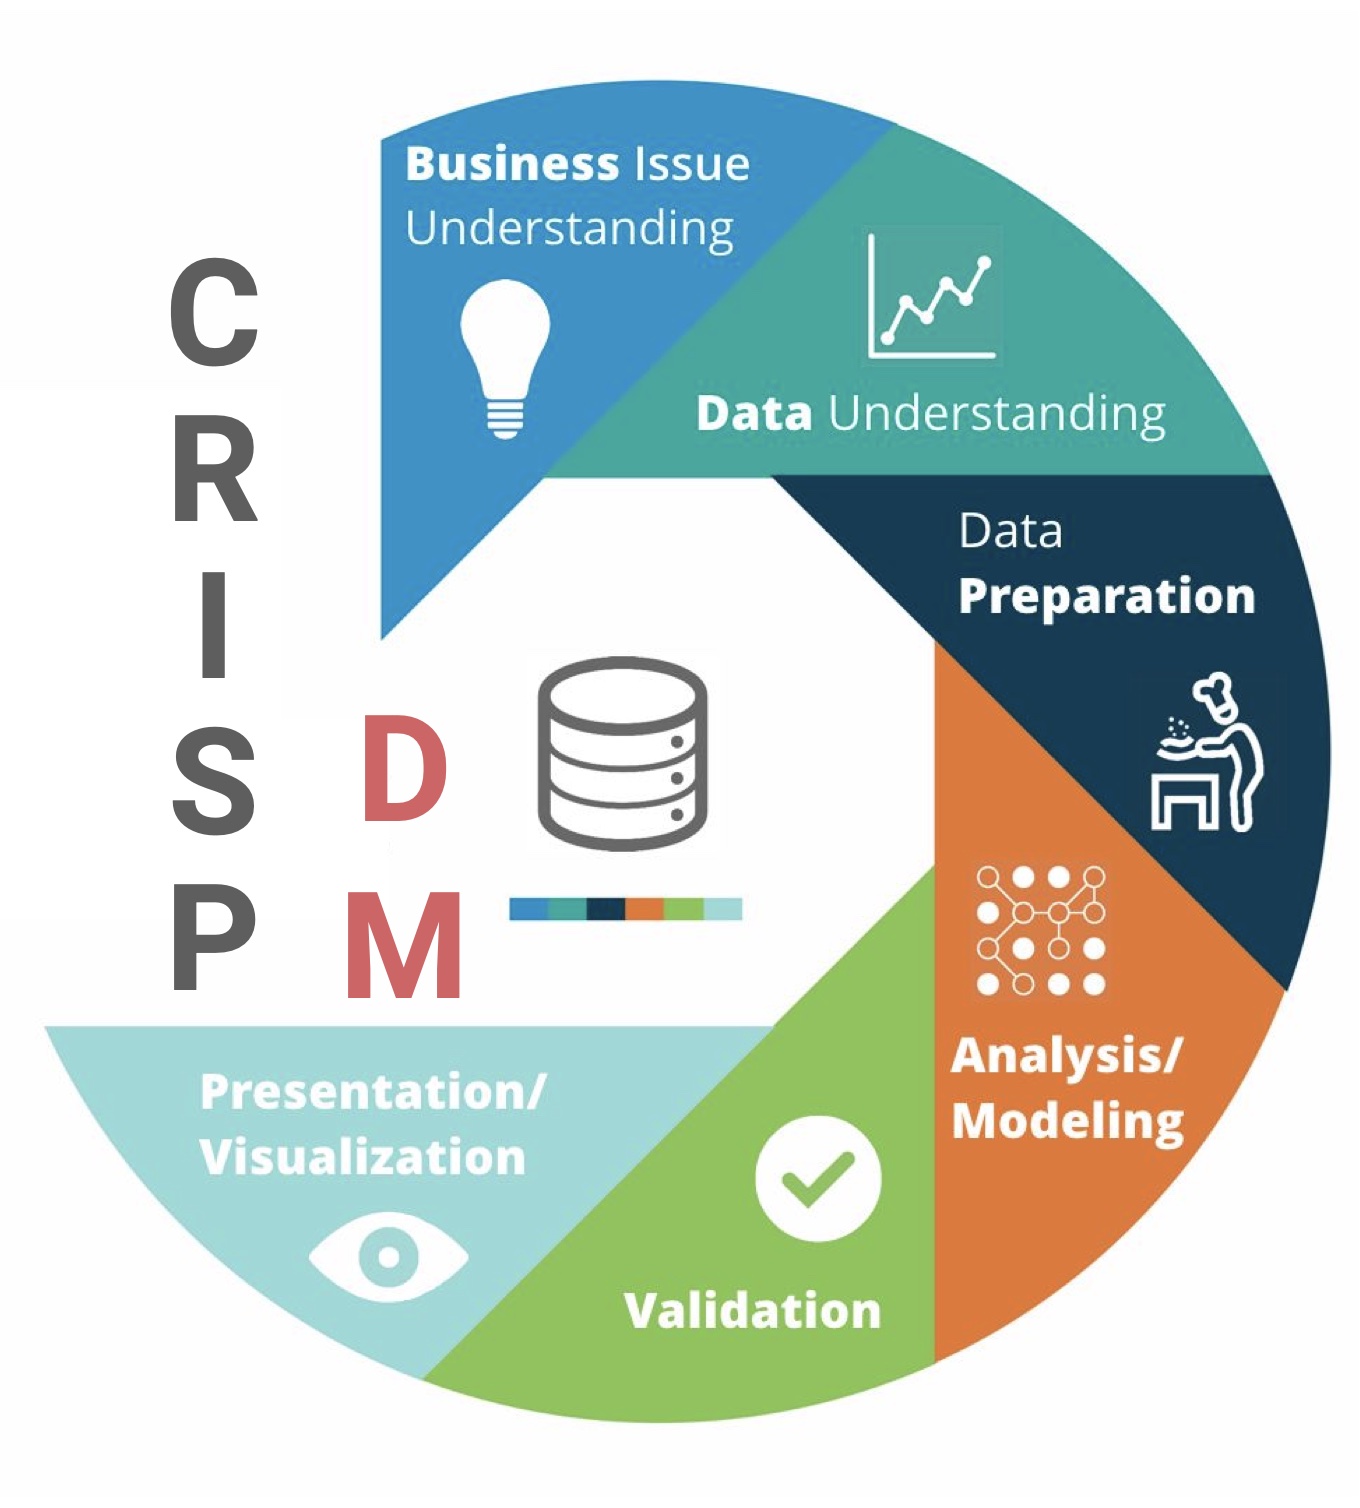
Suppose you wanted to discuss something, like the CRISP-DM process for analytics projects. You might wish to refer to an image of the process and you could include the image in the “Demo Post 1” folder and reference it here in the document.
You can easily insert the image through the visual editor in Posit / RStudio.
Data and Output
Lets look at some data.
library(tidyverse)
Warning: package 'ggplot2' was built under R version 4.3.2
Warning: package 'tidyr' was built under R version 4.3.2
library(ggthemes)
Warning: package 'ggthemes' was built under R version 4.3.2
data("USArrests")USArrests %>%ggplot(aes(x = Assault, y = Murder)) +geom_point(pch =21, color ="coral3", bg ="coral", size=3) +labs(title ="Arrests for Murder vs. Assault in US States",x ="Arrests for assault per 100,000",y ="Arrests for murder per 100,000") +theme_clean()
This would show us a relationship that we could then spend some paragraphs analyzing and interpreting.